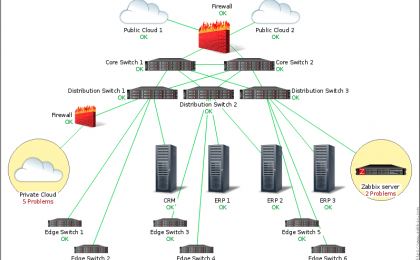
Zabbix network monitoring is the ultimate enterprise-level software designed for monitoring availability and performance of IT infrastructure components.
This allows you to gather virtually limitless types of data from the network. Zabbix network monitoring is completely open source and monitors anything you can think of including uptime, CPU usage, memory usage, disk I/O, disk usage etc . Databases like MySQL and Postgres can also be monitored. Other examples include services, processes, log files for specific text and even custom scripts on an endpoint with their resultant exit code status. Zabbix also has the functionality to run commands when certain triggers are met, this is also possible on windows hosts using WMI.
Zabbix supports:
- Agent based monitoring ( where you install a piece of software on the client to be monitored (Linux, Unix and Microsoft Windows))
- SNMP which is a network monitoring protocol that basically any network device/hosts supports
- Agentless monitoring like ports , ping times etc
High performance real-time monitoring means that tens of thousands of servers, virtual machines and network devices can be monitored simultaneously. Along with storing the data, visualization features are available (overviews, maps, graphs, screens, etc), as well as very flexible ways of analyzing the data for the purpose of alerting.
The Zabbix systems alerting function lets you know when thresholds are reached. An example is if a service stops running or disk usage reaches a certain percentage. Alerts can be via email, jabber or sms. The trending feature allows us to go back and have a look at the previous state of the system which aids in capacity planning for future growth.
Why choose Zabbix?
- Zabbix offers the freedom of using an open-source solution with no vendor lock-in and freely accessible source code. This includes not only Zabbix itself, but also required components (Linux, Apache, MySQL/PostgreSQL, PHP)
- Zabbix setup and configuration is quite easy ensuring a low learning curve and therefore low cost of ownership
- Highly efficient Zabbix agents for UNIX and Windows (x32, x64, Itanium) based platforms provide wider monitoring capabilities with greater speed
- A centralized monitoring system allows storage of all information (configuration and performance data) in a relational database for easier processing and re-use of data
- Rich visualization capabilities allow you to work with your data faster and smarter
- Built-in housekeeping procedures allow you to keep your data well organized
Zabbix can monitor:
- Databases – including MySQL, PostgreSQL, Oracle and Microsoft SQL Server
- Web Services – built-in web monitoring support which allows you to define sequential steps that Zabbix should take when analysing a website. Monitor availability, response time and download speed of your external website, e-commerce portal or internal wiki and service desk system.
- Hardware Monitoring – including IPMI access to runIPMI commands to turn on or off devices over the network when an issue occurs.
- Performance – performance indicators like CPU, memory, network, disk space and processes can be done easily with the Zabbix agent.
- Agentless Monitoring – check availability and the responsiveness of standard services such as e-mail or web servers without installing any software on the monitored devices.
- Network Devices – SNMP agents, present in all network devices like routers and switches. monitoring and capacity planning on your network providing key figures such as network utilization, CPU, memory and port status.
- VMware Monitoring – Virtual machine monitoring allows monitoring VMware vCenter and vSphere installations for various VMware hypervisor and virtual machine properties and statistics.
- Customize – The incredibly extensive customisation capabilities of Zabbix allow it to be integrated into any environment and gather data from financial systems, environment control systems or even sophisticated research devices. No limits on the scripting or programming language in use – have your own checks in shell, Perl, Python or anything else


